Wednesday 30 March 2016

Presentation and Visualization Methods

There are multiple ways of representing data that can be retrieved from underlying database or file system. Currently we have large number of enterprise business intelligence applications that can be used to present the data in terms of reports and dashboards. These reports or dashboards can be used by higher management to access the key performance metrics and analyze the data. These applications can also be used to drill down the charts and graphs to get the granular information.


Below I have described few data visualization for three industries.
  1. Transport
  2. Healthcare
  3. Sales
Transport
The power of web analytics techniques and big data visualization tools help the transportation industry perform traffic analysis, improve operations, reduce costs and better serve customers by crafting important insights from the large volume of data in underlying databases. 


The below graph shows the Cost Efficiency of different modes of Transportation.


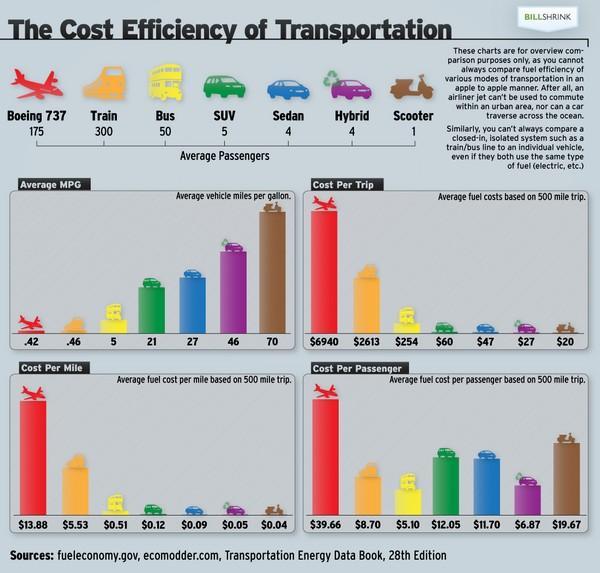
The above report shows 4 bar graphs representing multiple measures across different mode of transport. The first graph shows the average mileage coverage of different vehicles per gallon for different modes of transport. The other graphs represents the costs associated across multiple factors for different modes of transport. From graph 2, we can easily interpret that the cost per trip for airline mode of transport is highly costly. 

Healthcare
Healthcare industry is one of the emerging industry that is using analytics to derive meaningful insights. Depictions can be derived using data such as medication usage or hospital readmissions by health insurance companies for understanding the customers in better way.


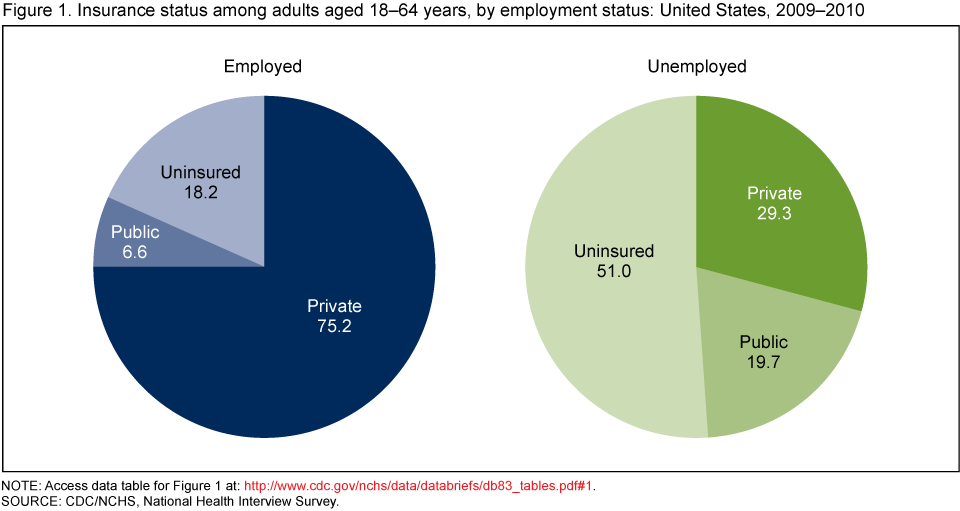
The above pie chart shows the insurance status of adults aged between 18-64 years as per employment status for the year 2009-10. Looking at the chart we can easily interpret that the most of the employed employees have private insurance. Whereas, 51% of the unemployed do not have insurance.

Sales
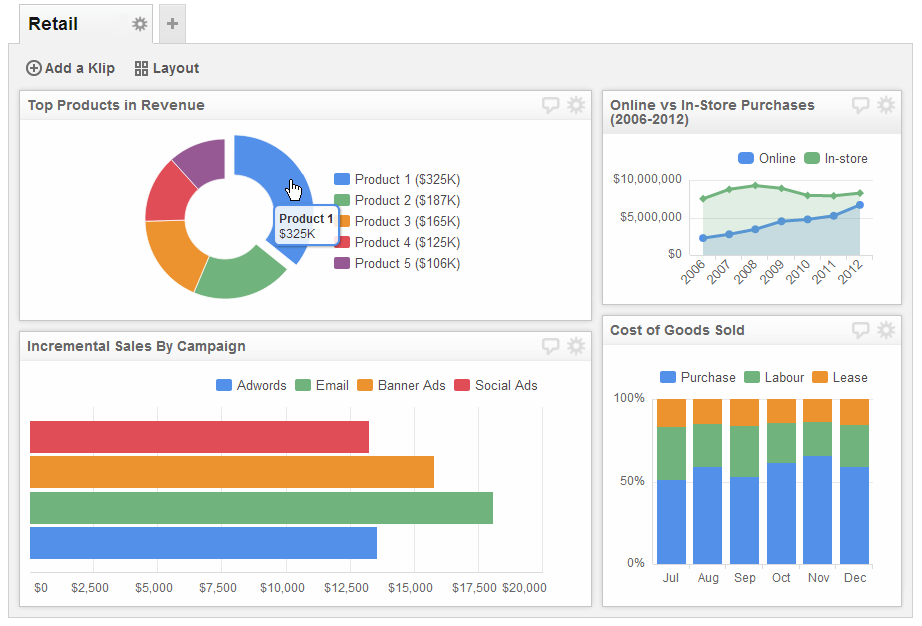
Every product company has a sales department that needs to measure the sales information across product, stores, and regions. There are multiple transactions having for products across locations every second, generating large amount of data. This data can be interpreted and visualized using visualizations tools such as Tableau. Below is a dashboard showing multiple reports in terms of different visualizations such as line graph, bar chart, stacked bar chart.

From the line graph comparing the online and in-store purchases we can easily derive that online sales of products have been increasing from past six years. Each dot on the line represents the sales value in dollars for a particular year. Using such graphs, it becomes easier for the organizations and management to uncover findings for strategic analysis.


In summary, we have seen how different visualizations can used be used across multiple industries by executives to interpret data and derive conclusions based on it. These visualizations also help them to make future strategic decisions. Therefore, visualizations tools such as Tableau and QlikView are currently being used and popular in industry. 

References - 
  1. https://www.klipfolio.com/resources/dashboard-examples/sales/sales-status
  2. http://www.usatoday.com/story/news/nation/2013/11/24/big-data-health-care/3631211/
  3. www.visualinformation.info


Wednesday 2 March 2016

Big Unstructured Data v/s Structured Relational Data

Structured Data


Structured Data refers to any data that resides in a fixed field within a record or file. This includes data contained in a relational databases or spreadsheets. Structured data is a general name for all markups that abides by a predetermined set of rules. These rules include defining types of data and also the relationships between them. Structured Query Language (SQL) is most commonly used to manage structured data. SQL helps us perform several operations to analyze the data and fetch desired results. These operations include search, insert, update, delete and others.

Unstructured Data


Unstructured Data refers to any data that does not resides in traditional row-column database. Unstructured data includes files such as text files or multimedia content (e.g. emails, videos, photos, web pages, etc). Unstructured data is not relational and does not fit into any pre-defined data models. There are multiple techniques such as data mining, data analytics, NLP to process the unstructured data and try to find patterns in the data.

Structured vs Unstructured Data


Structure Data
Unstructured Data
Representation
Discrete – rows and columns
Less defined boundaries and less easily addressable
Storage
DBMS or file formats
Unmanaged file structures
Metadata
Syntax
Semantics
Integration Tools
ETL
Batch processing or manual data entry
Standards
SQL, ADO.net, ODBC
XML, SMTP, SMS
Examples
Sales Data, Sensor Data
Images, Videos, Natural language text

Data Types and Data Volume


Currently all organizations are concerned with Big Data. Big data refers to extremely large datasets that are difficult to analyze with traditional tools. Big data can include both structured and unstructured data, but IDC estimates that 80 percent of big data is unstructured data. And the amount of Big Data is increasing continuously in organizations, more faster than the structured data.


Since the volume of unstructured data and structured data is growing so rapidly, organizations are looking for technological solutions to store this data and manage the data. These solutions include both hardware and software solutions that enable enterprises to make efficient use of the available storage space. This is where data warehouse concept comes into play. A data warehouse is a database that is designed to maintain historical data and analyze the data to gain a better understanding of the business and improve. A data warehouse can be used to enable Business intelligence activities, helping users to understand and enhance organization's performance. A data warehouse environment can include an extraction, transportation, transformation, and loading (ETL) solution, statistical analysis, reporting, data mining capabilities, client analysis tools, and other applications that manage the process of gathering data, transforming it into useful, actionable information, and delivering it to business users.

Limitations of Data Warehouse in terms of Data Analysis


  1. Data load process that includes extraction, transformation and loading of the historical data might take longer time and hence, the time to develop the data warehouse will significantly increase.
  2. During data loading process inconsistent data might be loaded and result in performance degradation.
  3. In some cases, important information related to the business process under analysis is not captured by the source system but maybe important for strategic decision making.
  4. Integration of data from various disparate sources is a highly complex task. Also, a different tool performs each task within a data warehouse and integration of all these tools also increases the complexity of implementing a data warehouse.
  5. Data warehouses are high maintenance systems. If there are changes in the business processes (and hence, the data) then it will result in a change in the data warehouse and would result in very high maintenance costs.

Future of Data Warehouse


Data warehousing has never been more valuable before and is been used widely across enterprises. Making decisions based on data is so fundamental and obvious that the current generation of business users and data warehouse designers can’t imagine a world without access to data. Traditional data warehouse ETL has become too slow, too complicated, and too expensive to address the torrent of new data sources and new analytic approaches needed for decision making. The new ETL environment is already looking drastically different by supporting data feeds of huge bandwidths and multiple data sources.

Also enterprises moving to single unified system to access data which is achieved using Cloud-based technologies. Companies looking for cloud-based data warehouse might become the norm. The cloud based solutions provides flexibility, performance improvements and analytic tools support such as BI consulting, Data Analytics, and Big data, providing additional reason for cloud based data warehouse. Cloud based solution will also reduce maintenance and management costs.

References


Wednesday 17 February 2016

Dimensional Modelling for Fry's Food Store


Company Background:

Fry's Food & Drug Stores, Inc. is a chain of supermarkets that was founded in the year 1954 in California and was later expanded in Arizona state in USA. The store was bought by Kroger in year 1998 and expanded in other states in USA. The Fry's store is a multi-department store that offers grocery, pharmacy and other general products such as electronics, toys and home goods. Fry's store is currently in 100+ locations and has 18,000+ employees. Each store sells 10,000+ products of various categories such as bakery, dairy, frozen food, pharmacy, liquor and many more. The stores have checkout systems that are managed by Fry's employee or self checkout system. Fry's store also allow online ordering system so that people can order online the required items and collect them later. The store offers membership cards and provides discount to customers. The store also conduct promotional offers on particular dates and distribute discount coupons.

Performance Metrics:
Below are some of the performance metrics that a CEO or manager of Fry's stores will be interested for tracking.
1. Sales value for a particular product across time.
2. Sales value and number for all products at a location across time.
3. Sales value of a particular product/s at a location/region.
4. Sales value of a particular product/s during a day of week.
5. Sales number of products at a particular location.
6. Sales number of products on a promotional offer day.

These performance metrics will help the CEO understand how a particular store is performing at a particular location, how many products are sold every day, which is the highest selling product on regular days and promotional offer day and sales revenue across time.

Dimensional Model:
To get the above mentioned metrics we need to store the transaction data at its most granular layer. In this case, we need to build a transaction snapshot dimension model. The transaction model will help us capture which customer bought a 'x' quantities of a particular product at a particular price at a particular location. This dimension model can be used to capture a snapshot of the sales at the end of each month providing details of the sales amount and quantity of various products across multiple locations. The analyst can also derive the products and sales amount across multiple locations for a particular customer or average the sales amount during promotional offers across time.

Below is a sample dimensional model snapshot for retail store.


References:
1. https://en.wikipedia.org/wiki/Fry%27s_Food_and_Drug
2. https://www.frysfood.com/
3. https://retaildatawarehouse.wordpress.com/2011/05/18/dimensional-data-model/
4. http://learndatamodeling.com/blog/dimensional-data-modeling/

Wednesday 3 February 2016

Business Intelligence Products Analysis

Hi All,

This blog describes various Business Intelligence & Analysis products present in the market and their features. The blog also provides a weighted analysis and compares various products. I hope you all find this blog interesting and provides more insight to you on the various BI products.

Below are some criteria that I think companies should consider when choosing BI tools. However the criteria can change based on the companies requirements.

1. Data Compatibility - Business Intelligence tools are used mostly for visualizations and understanding the data quality and quantity to take the appropriate actions. In-order to gain perspective on the data and visualize it the BI tool should be able to consume the data in the format stored inside the organization. The BI tool should be able to support multiple data formats and must be easy to integrate to the existing tools.

2. Performance and Scalability - When using the BI tool you will be accessing data using queries and a large number of queries will be running simultaneously. The BI tool should be able to handle the load and provide the results without a large delay in the reporting. Further, in future the amount of data being processed will increase gradually. BI tool must be scalable to handle that amount of data. If handling large data and the tool's inefficiency to process the data can cause issues and frustration in future. 

3. Modeling and Analytics - The BI tool must have the right power and must also be easy to use to obtain analysis the business people need. The tool must perform analysis and also prepare the data so that the user can perform adhoc analysis. The tool should also support accessing Online Analytical Processing (OLAP) cubes and enable Pivot-style analysis.

4. Usability - This is one of the important criteria that companies should consider. Most of the BI vendors will provide other capabilities but the tool must be easy to use. Having n number of features but not providing a guide on how to use the tool and improper UI can lead to frustration for users. The tool should have an interactive and flexible dashboard with the capability to add reports with informative visualizations.

5. Cost Effectiveness - All the BI tools must be cost effective for an organization. The cost analysis must be performed on the needs of the organization, the gains earned from the BI tool with respect to the spending done. Must of BI tools provide similar set of features, hence cost will one of the important decision factor. Organization must consider following cost factors 
  • License Cost
  • Maintenance Cost
  • Open source tool or not 


Below is the table that mentions all the important criteria's considered and weight assigned to each criteria. Based on these criteria we have ranked each tool.


Weight
Tableau
QlikView
Tibco
Pentaho
SAS
Data Compatibility
25%
10
9
7
8
8
Performance & Scalability
20%
8
7
7
7
7
Modeling & Analytics
30%
8
7
9
8
8
Usability
15%
10
8
7
6
7
Cost Effectiveness
10%
8
7
6
8
9
Points

8.8
7.7
7.4
7.5
7.8
Rank

1
3
5
4
2


Based on the analysis and weighted score I have ranked Tableau as the number one and ranked Tibco as last best Business Intelligence tool. Tableau, most promising features are the data compatibility and integration with a variety of data files and databases, and the easy to use and interactive dashboard & visualizations. These capabilities make it easy for the business users to quickly grasp the insights and for IT personnel to integrate with existing systems.

Tableau is followed by SAS and other tools that have a small difference between the weighted score analysis. SAS sets itself apart from QlikView because of the costs effectiveness factor. This is important factor if two products have similar features and same capabilities. In case of a tie, organizations will go for the cost effective product and hence I have rated SAS above QlikView. Other than this criteria, SAD beats QlikView in the Modeling and Analytics capabilities provided by the tool.

The last to positions are taken by Tibco and Pentaho. Although Tibco beats Pentaho in the analytics capabilities but is not as cost effective with respect to Pentaho. Along with this Pentaho provides good data integration and compatibility capabilities. Though Tibco ranks last, it provides good usability and is easy to use as compared to Pentaho.

In conclusion, I would like to mention that Tableau ranks as the top BI tool. Also, Tableau has released its latest mobile application, providing users capability to work on mobile devices. Please find below market share of Tableau till Feb,2015.


References -